HOOK Mesonet Summary
 Tweet
TweetMesonet Station Summary
CAUTION: Mesonet data are only available since 1994, a period considered too short to give reliable climate statistics for temperature and precipitation. Cooperative observer sites are strongly recommended for these purposes. Other variables, such as humidity, soil temperatures, and winds, are not available from cooperative observer sites and Mesonet represents the best-available information.
|
HOOK Hooker (Hooker 1.0 W ) |
||
|
|
Texas County |
Climate Division: 1 |
|
|
Latitude: 3651N; Longitude: 10113W |
Elevation: 2992 ft |
|
|
Period of Record: |
19940101-20101231 |
|
Monthly Averages (1994-2010) |
|||||||
|
|
Temperature (deg Fahrenheit) |
Precipitation (inches) |
Wind (Miles Per Hour) |
Solar Radiation |
|||
|---|---|---|---|---|---|---|---|
|
|
Daily Max |
Daily Min |
Daily Avg |
Monthly Average |
Direction |
Speed |
Daily Avg (MJ/m2) |
|
January |
|
|
|
|
|
|
|
|
February |
|
|
|
|
|
|
|
|
March |
|
|
|
|
|
|
|
|
April |
|
|
|
|
|
|
|
|
May |
|
|
|
|
|
|
|
|
June |
|
|
|
|
|
|
|
|
July |
|
|
|
|
|
|
|
|
August |
|
|
|
|
|
|
|
|
September |
|
|
|
|
|
|
|
|
October |
|
|
|
|
|
|
|
|
November |
|
|
|
|
|
|
|
|
December |
|
|
|
|
|
|
|
|
Annual |
|
|
|
|
|
|
|
|
Monthly Extremes (1994-2010) |
|||||||||
|
|
Temperature (F) |
Precipitation (inches) |
Wind Speed |
||||||
|---|---|---|---|---|---|---|---|---|---|
|
|
Record High |
Record Low |
Monthly Max |
Daily Max |
Rain Rate (in/hr) |
Peak Gust (mph) |
|||
|
Jan |
|
|
|
|
|
|
|
|
|
|
Feb |
|
|
|
|
|
|
|
|
|
|
Mar |
|
|
|
|
|
|
|
|
|
|
Apr |
|
|
|
|
|
|
|
|
|
|
May |
|
|
|
|
|
|
|
|
|
|
Jun |
|
|
|
|
|
|
|
|
|
|
Jul |
|
|
|
|
|
|
|
|
|
|
Aug |
|
|
|
|
|
|
|
|
|
|
Sep |
|
|
|
|
|
|
|
|
|
|
Oct |
|
|
|
|
|
|
|
|
|
|
Nov |
|
|
|
|
|
|
|
|
|
|
Dec |
|
|
|
|
|
|
|
|
|
|
Annual |
|
|
|
|
|
|
|
|
|
|
Mean Monthly Humidity and Moisture (1994-2010) |
|||||
|
|
Daily Max Relative Humidity |
Daily Min Relative Humidity |
Daily Average Relative Humidity |
Daily Average Dewpoint |
Daily Average Vapor Deficit |
|---|---|---|---|---|---|
|
January |
|
|
|
|
|
|
February |
|
|
|
|
|
|
March |
|
|
|
|
|
|
April |
|
|
|
|
|
|
May |
|
|
|
|
|
|
June |
|
|
|
|
|
|
July |
|
|
|
|
|
|
August |
|
|
|
|
|
|
September |
|
|
|
|
|
|
October |
|
|
|
|
|
|
November |
|
|
|
|
|
|
December |
|
|
|
|
|
|
Annual |
|
|
|
|
|
|
Soil Temperature at 10 cm (4-inch) Depth (1994-2010) |
|||||
|
|
Average Temperature Beneath Sod |
Average Temperature Beneath Bare Soil |
Average Daily Max Temperature |
Average Daily Min Temperature |
|
|---|---|---|---|---|---|
|
January |
|
|
|
|
|
|
February |
|
|
|
|
|
|
March |
|
|
|
|
|
|
April |
|
|
|
|
|
|
May |
|
|
|
|
|
|
June |
|
|
|
|
|
|
July |
|
|
|
|
|
|
August |
|
|
|
|
|
|
September |
|
|
|
|
|
|
October |
|
|
|
|
|
|
November |
|
|
|
|
|
|
December |
|
|
|
|
|
|
Annual |
|
|
|
|
|
|
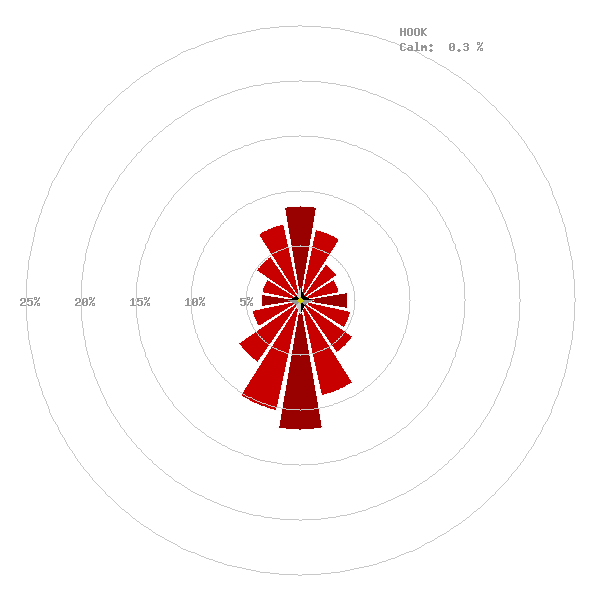
Wind Rose: Wedges show the percent of time for each direction from which the wind blows |
|||||
|
|||||
|---|---|---|---|---|---|