Tue, Oct 10, 2023
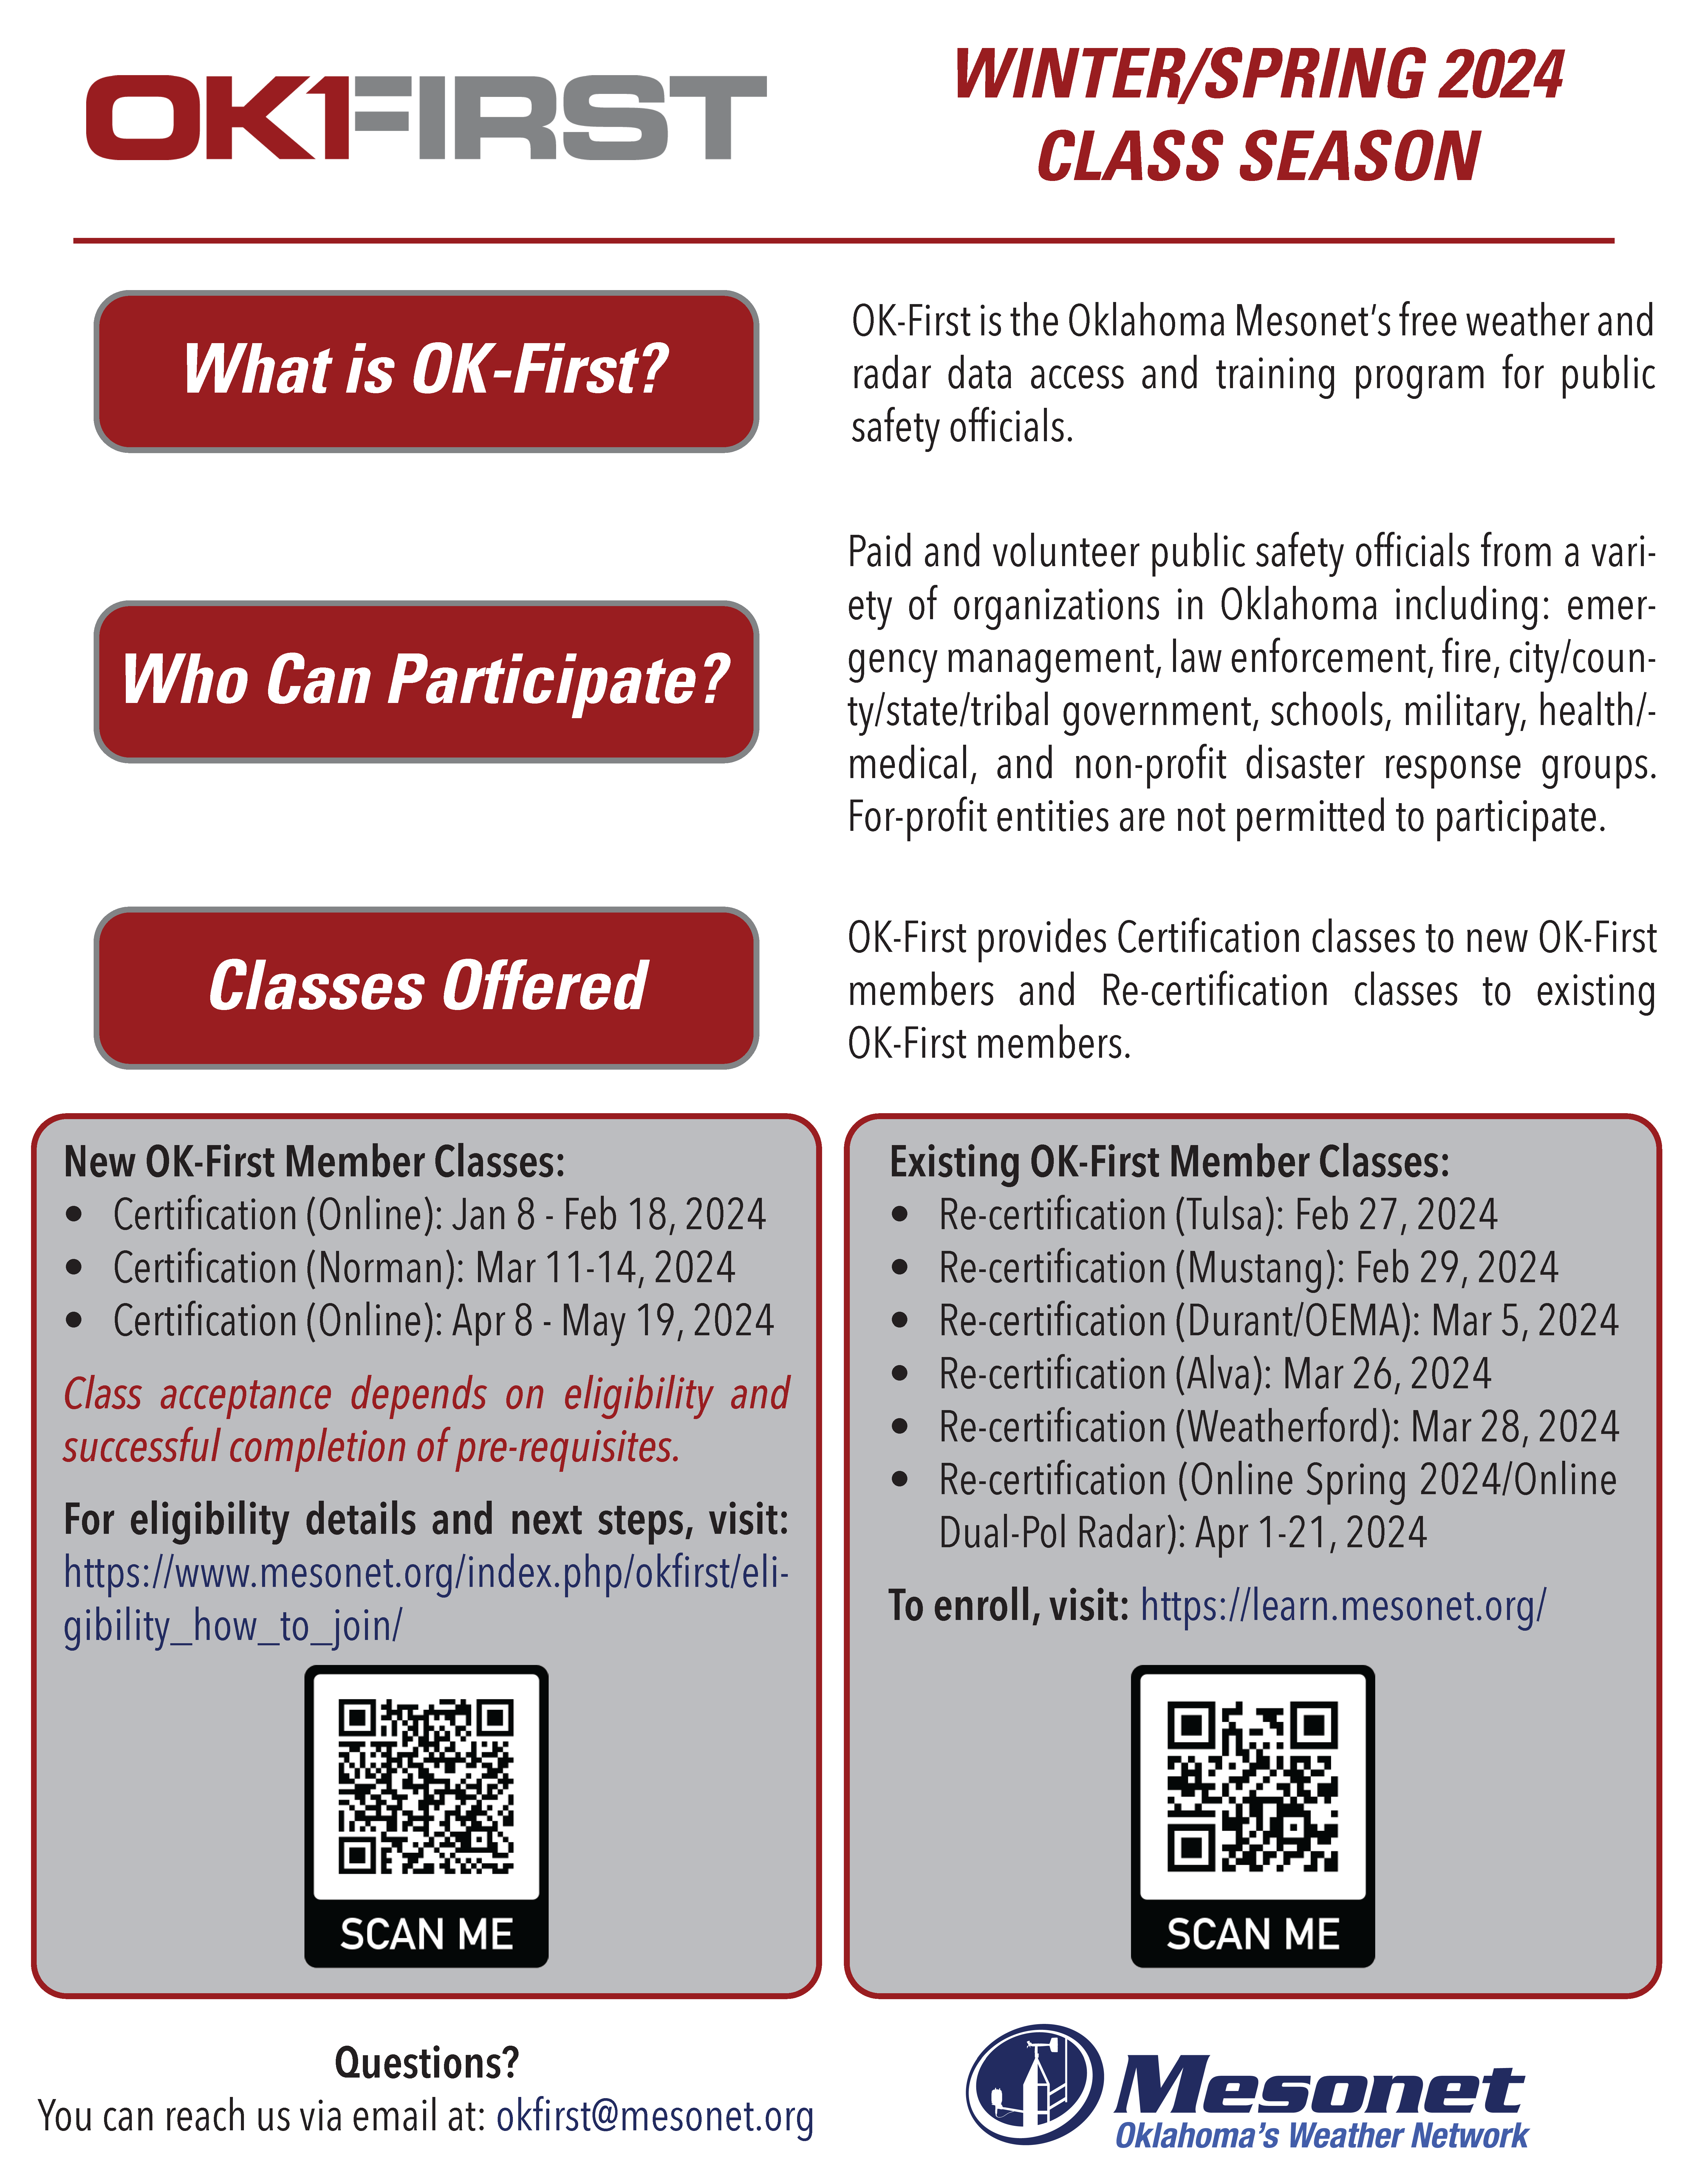
Winter/Spring 2024 Mesonet OK-First Classes Winter/Spring 2024 Mesonet OK-First classes for public safety officials are now open for enrollment! We will be offering a mix… Read More »
Thu, Apr 27, 2023
Summer/Fall 2023 Mesonet OK-First Classes Summer/Fall 2023 Mesonet OK-First classes for public safety officials are now open for enrollment! We will be offering a mix… Read More »
Tue, Jan 03, 2023
December Caps 2022 Rain Record December provided a fitting end to Oklahoma’s tumultuous 2022 weather story. This final chapter came complete with a half-dozen tornadoes,… Read More »
Tue, Nov 01, 2022
October Drought Relief Mixed Drought held on through October in Oklahoma for the fifteenth consecutive month, its roots dating back to August 2021 and… Read More »
Tue, Oct 11, 2022
Winter/Spring 2023 Mesonet OK-First Classes Winter/Spring 2023 Mesonet OK-First classes for public safety officials are now open for enrollment! We will be offering a mix… Read More »
Mon, Oct 03, 2022
September Continues Dry Dusty Weather Drought surged across Oklahoma as the driest September since 1956 took its toll on the state’s landscape. The amount of… Read More »
Wed, Aug 17, 2022
Fall 2022 OK-FIRE Classes Free training workshops will be offered this fall for both new and experienced users of OK-FIRE, the statewide weather-based decision support system… Read More »
Mon, Aug 01, 2022
July Heat Punishes Oklahoma The seemingly impenetrable heat wave and dry spell that had punished Oklahoma since early June continued through nearly all of… Read More »
Fri, Jul 01, 2022
June Teases Several Seasons June managed to pack pieces of three seasons into a single month. The first 10 days were quite springlike, with… Read More »
Wed, Jun 01, 2022
May Rains Dent Drought May’s reputation as Oklahoma’s most prolific severe weather month was confirmed within the first week with as many as… Read More »
Mon, May 02, 2022
April Winds Highest in Mesonet Era Opinions on Oklahoma’s weather are often more variable than the weather itself. Some Oklahomans will look back on April… Read More »
Wed, Apr 13, 2022
Summer/Fall 2022 Mesonet OK-First Classes Summer/Fall 2022 Mesonet OK-First classes for public safety officials are now open for enrollment! We will be offering a mix… Read More »
Fri, Apr 01, 2022
Variety Describes March Weather March’s weather ran the gamut of nearly all the hazards Oklahoma has to offer, befitting a seasonal transition month in… Read More »
Tue, Mar 01, 2022
Wintry Weather Rules February Three impactful winter storms struck Oklahoma during February, snarling traffic on state highways, bringing down power lines, and forcing… Read More »
Tue, Feb 01, 2022
Winter Arrives In January Winter arrived with conviction at the dawn of the new year in Oklahoma and delivered a startling counterpunch to the… Read More »
Tue, Jan 04, 2022
December Shatters Temperature Record In what could best be described as a climatological anomaly on steroids, Oklahoma soared to its warmest December on… Read More »
Wed, Dec 01, 2021
November Caps Off Warm, Dry Fall An extended pattern of warm, dry weather exacerbated drought conditions during November. Drought impacts, including fire danger and soil… Read More »
Thu, Nov 18, 2021
Spring 2022 Mesonet OK-First Classes Spring 2022 OK-First classes for public safety officials are now open for enrollment! We will be offering a mix of… Read More »
Mon, Nov 01, 2021
October Sets Tornado Record Oklahomans are growing accustomed to Mother Nature’s October weather shenanigans following a snowstorm of up to 13 inches in… Read More »
Tue, Oct 05, 2021
Fall 2021 OK-FIRE Classes Free training workshops will be offered this fall for both new and experienced users of OK-FIRE, the statewide weather-based decision… Read More »
Tue, Oct 10, 2023