
Oklahoma Climate
Long-term Averages & Extremes


Fall and Spring Freeze Maps


Climate Overview & Events
-
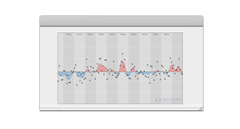
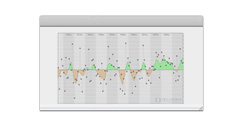
Oklahoma weather timeline
The Oklahoma Weather Timeline provides a decade-by-decade listing of interesting or disastrous events that have occurred in Oklahoma's weather history. For more detailed daily summaries (since 2003) please view the Oklahoma monthly climate summaries.
-
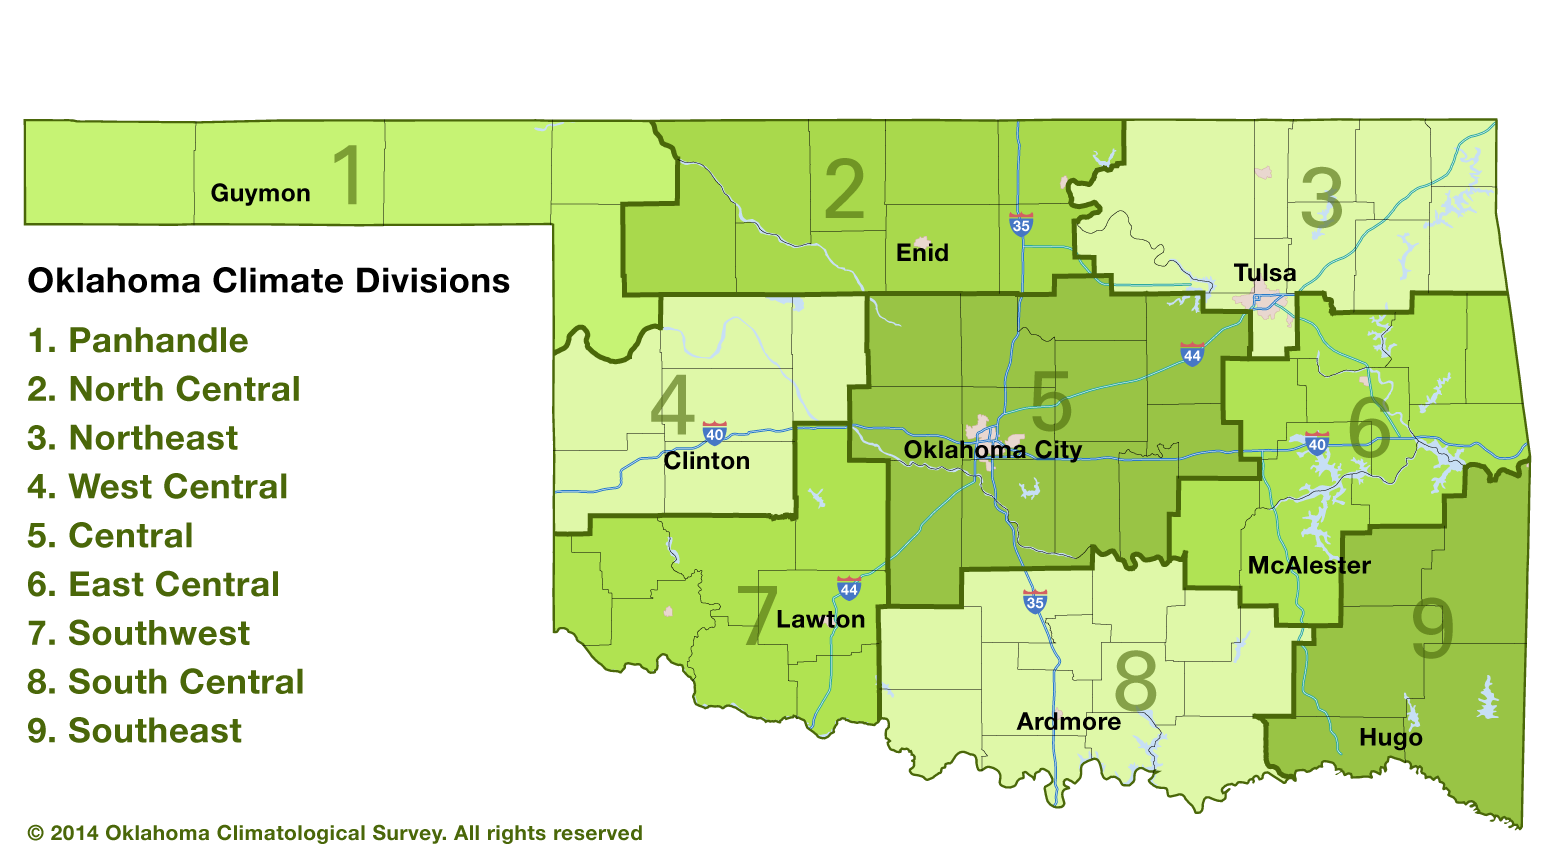
Climate Overview
A climate overview for the state of Oklahoma.
-
State Records
Temperature, precipitation, and other state weather extremes.
Other Climate-related Maps


Copyright © 1994-2024 Board of Regents of the University of Oklahoma. All Rights Reserved.